Racecast Weather - Your Source for Race Weather Information
  • Home
  • Racecasts
  • 2023 Schedule
  • Services
  • Contact
  • Bios
  • Links

Long term weather outlook for Florida for January through March 2019

12/26/2018

Comments

 
By Doug Schneider

The 2019 racing season is almost upon us, and we're excited to bring you another year of weather forecasts! You can check out the full schedule of race forecasts that we have planned for the year in the 2019 Schedule link at the top of the page. There may be some additional races to be added later, depending on whether we can find sponsorship (and if you're interested in sponsoring our forecasts, click on the Contact link at the top of the page). 

During January, February, and March, the season openers for all the major North American racing series take place in Florida. Around this time each year, I take a look at the long term outlook for Florida as forecast by the Climate Prediction Center. These guys are the experts at long term forecasting on time scales from a week to several months, so the graphics you see below are taken directly from them. If you'd like to learn more about what goes into making a long term forecast, see this post I wrote a few years ago.

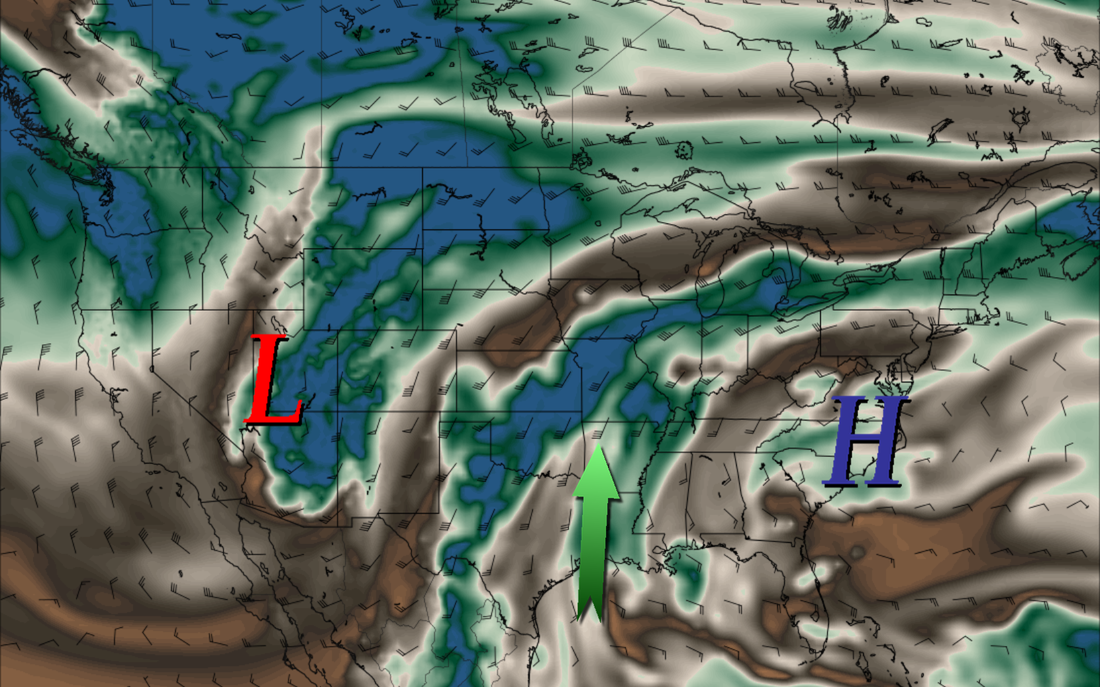
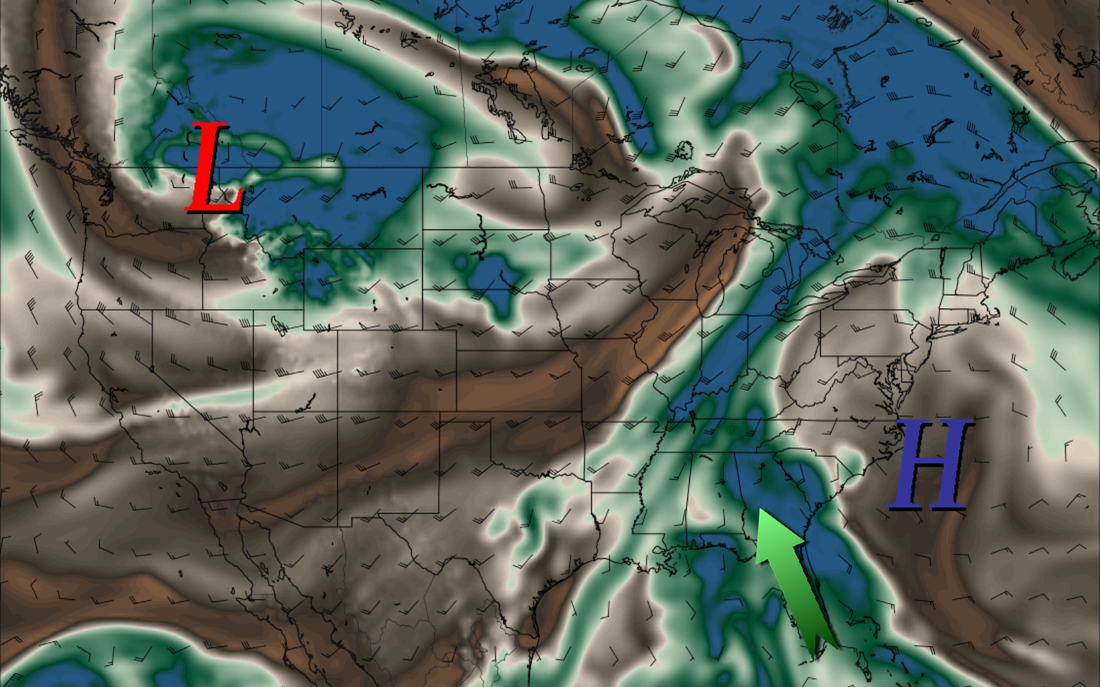
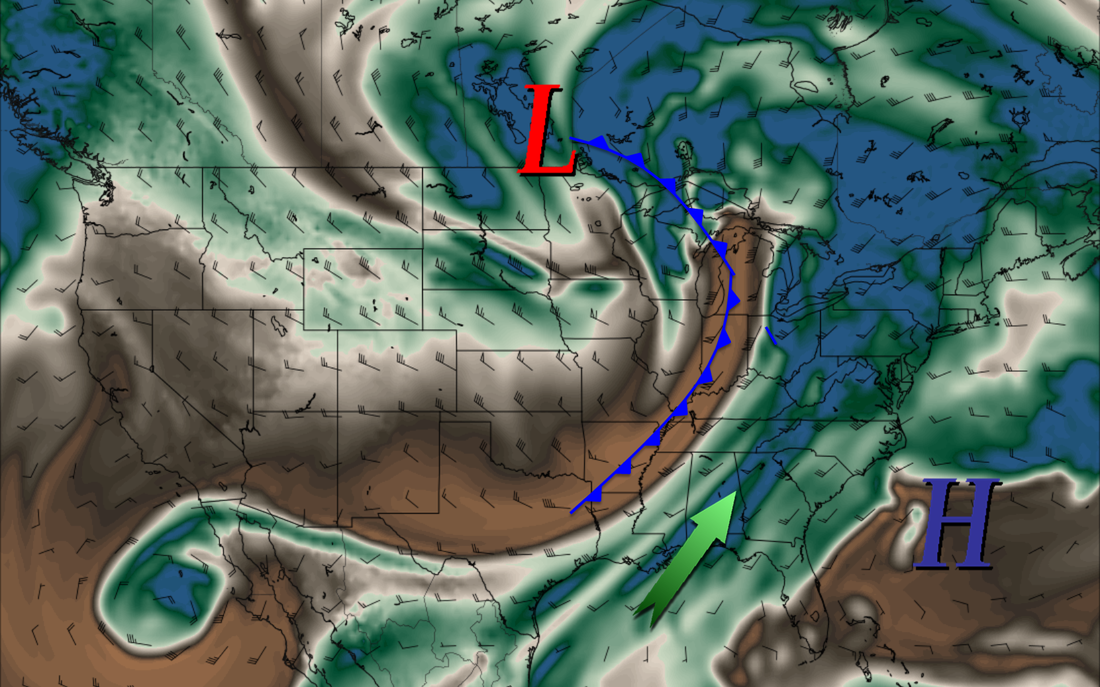
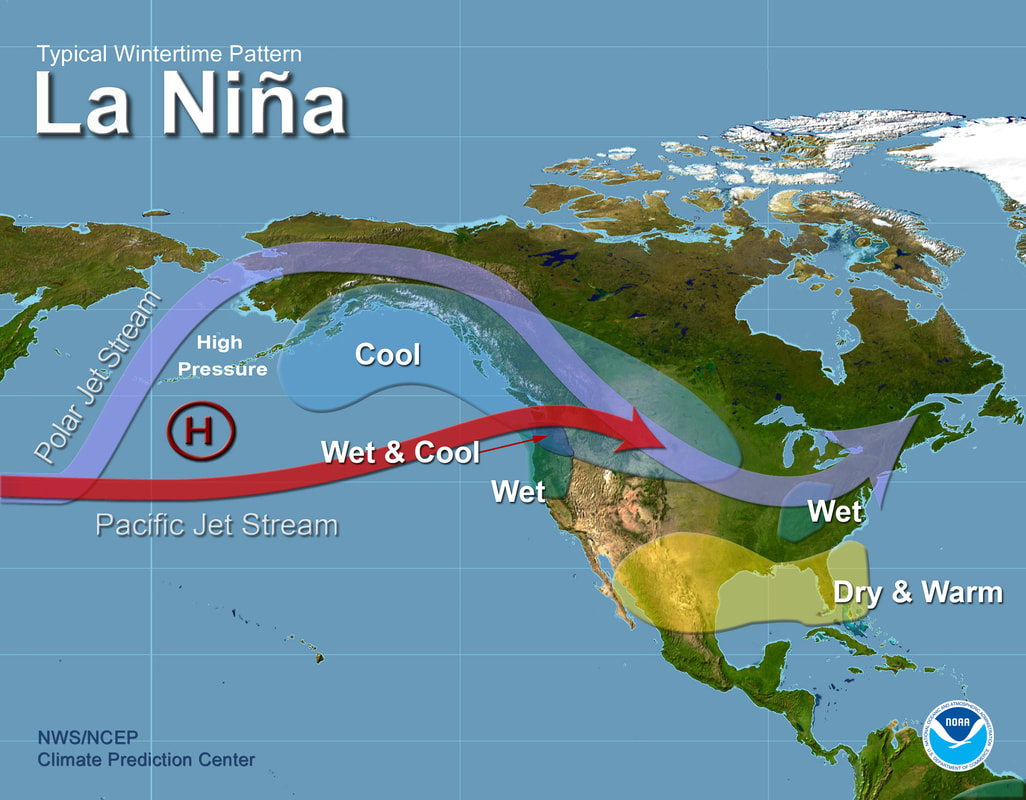
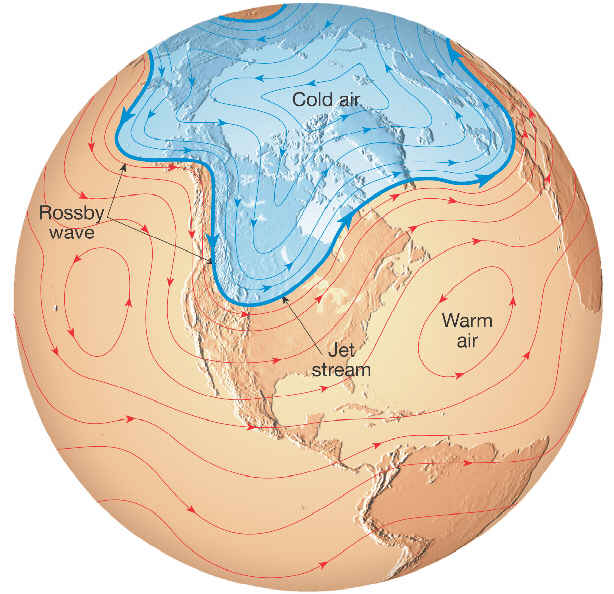
Water temperature at the ocean surface is a big factor in predicting the long term weather patterns. Perhaps the most significant and well known ocean temperature anomaly is the El Niño-Southern Oscillation (ENSO) cycle (for more info about El Niño, click here). It affects the location of the jet stream across the Pacific Ocean, which in turn affects the track of low pressure systems across the United States. The change in the typical tracks of storms can cause increased precipitation across California and the southern U.S. While long term forecasters cannot say exactly how much rain will fall or how warm/cold temperatures will be, knowing if there will be an El Niño can help forecasters determine whether precipitation and temperature is likely to be above or below normal over a period of several months in a certain area. 

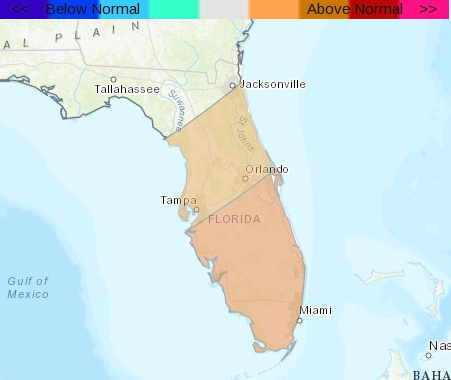
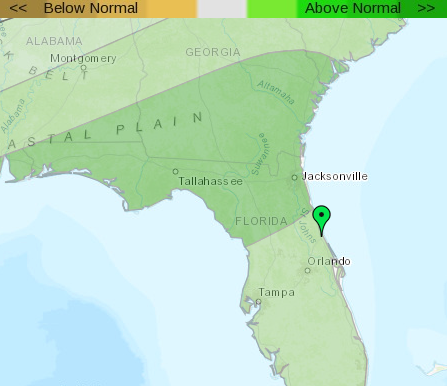
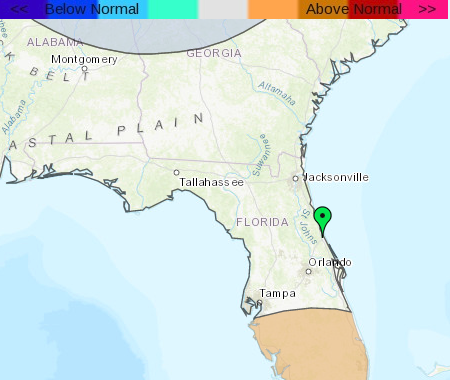
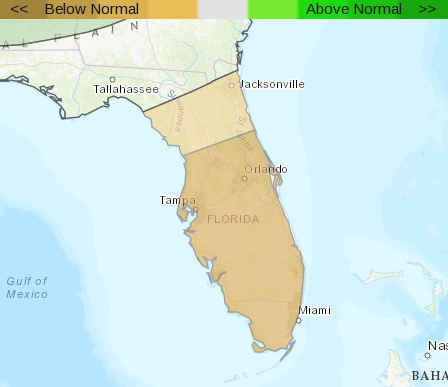
The CPC is expecting a weak El Niño through the rest of the winter and into the spring. When there is an El Niño, the southeastern United States tends to have a higher likelihood of above normal precipitation. The image below shows that Daytona Beach is located in the area that has a 50% chance of seeing above normal precipitation during January, February, and March.
Picture
The three-month temperature forecast below shows Daytona Beach in an area where there are equal chances of above or below normal temperatures. This means that the the predicted atmospheric pattern does not give a clear signal of whether temperatures or precipitation will be above or below normal. However, it is interesting to note that the southern half of Florida (including Sebring) has a low chance (about a 36% chance) of above normal temperatures. 
Picture
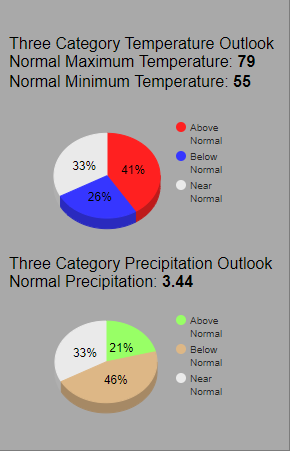
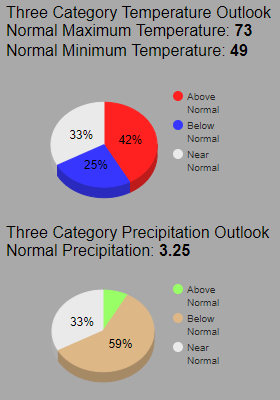
Another way to visualize these outlooks is by using a pie chart. There are three categories of what could happen with temperature and precipitation - above normal, below normal, or near normal. Splitting the pie equally would give about a 33.3% chance of each. Below is the three category outlook for Daytona Beach.  
Picture
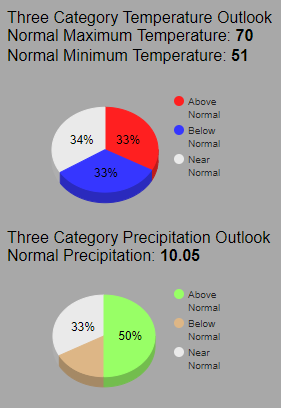
The top pie chart tells us that there's a nearly equal chance of above, below, or near normal temperatures at Daytona in January, February, and March. Honestly, that doesn't tell us very much. However, the bottom pie chart of precipitation tells us that there is a 50% chance of above normal precipitation. The "above normal" slice of the pie is the largest slice, so it is the most likely outcome of the three. 

The normal amount of rainfall at Daytona Beach during January, February, and March is 10.05 inches. The outlook is telling us that the amount of rainfall during the same period in 2019 is likely to be more than that. It does not tell us how much more, or when the rain is going to occur. It is possible that every day of racing in Florida could be dry, and yet this outlook would still be accurate. 

That's the extent of what meteorologists can tell about the weather this far out in advance. You will probably see forecasts out there that show the exact temperature and rain chance for a specific day weeks in advance, but don't take those forecasts too seriously. Those type of forecasts are going beyond the limits of what science can tell us with reasonable confidence. 
Comments

Weather outlook for Petit Le Mans

10/4/2018

Comments

 
By Doug Schneider

Since I'm going to be attending Petit Le Mans, I've been closely watching the models over the past few days. I thought I'd share a general overview of what I'm seeing. Unfortunately, the pattern appears to be shaping up to be a wet one.

The weather pattern for this weekend and early next week across the Southeast will feature a strong high pressure area centered over North Carolina, which will provide warm temperatures and a small (20-30%) chance of showers and thunderstorms each afternoon over north Georgia. This is a typical summer-time pattern for the region, but one that is unusually warm for October. 
Picture
GFS model depiction of winds and moisture in the midlevels of the atmosphere on Sunday 10/7.
​​As we get into the middle part of next week, the high pressure ridge will be shifting eastward off the East Coast, which will produce a flow of moist air from the Gulf of Mexico and Atlantic Ocean into Georgia and the Southern Appalachians. With the high pressure area weakening its grip and greater moisture moving in, the chance of rain will be rising in the Wednesday/Thursday time frame of next week.
Picture
GFS model depiction of winds and moisture in the midlevels of the atmosphere on Wednesday 10/10.
The high pressure ridge remains off the East Coast, but a low pressure trough and cold front will begin to track east across the Great Plains late next week. This will strengthen the southerly flow and bring even more moisture into Georgia. A cold front associated with this low pressure system may move into the Southeast states next weekend, which would provide lift and make the chances of rain on race day even higher. 
Picture
GFS model depiction of winds and moisture in the midlevels of the atmosphere on Saturday 10/13.
​Another factor in all this is a tropical system that some the models have been showing in the Gulf of Mexico for the past few days. It's extremely difficult to make any accurate predictions about tropical cyclone formation this far out, but it has been a feature in more than one model for multiple model runs. If there is a tropical cyclone in the northern Gulf late next week, the pattern of a ridge off the East Coast and a trough in the Plains would tend to steer that system northward, into the Southeast states (the GFS model in the above images is one model that does not develop a tropical system - the ECMWF and GFS-FV3 do develop it and track it into the Southeast). 
​
So here's what I can say today about the outlook for Petit with a moderate amount of confidence:
​
- A good chance of rain each day of the event, with the highest chance of rain on Saturday.
- Mild temperatures and high humidity each day.

Any other details of the forecast, such as rain amounts, have low confidence at this time. And it's WAY too soon to speculate that this will be a repeat of the rain-shortened 2015 Petit Le Mans. The weather pattern this year looks very different than it did that year.

As always, please keep in mind...
Picture
​I'll have the full forecast graphic posted here on Sunday. Hopefully by then I can bring some good news for better racing weather than I'm seeing today. I have a feeling this is going to be a tough forecast.
Picture
Comments

Long term outlook for March in Florida

2/17/2018

Comments

 
By Doug Schneider

Back in December, I took a look at the 3-month long term weather outlook for Florida, covering January, February, and March. I thought I'd follow up that post with another look at the month of March. 

That three-month outlook favored above normal temperatures and below normal precipitation. Through January and February, that outlook seems to be working out. Using Winter Haven, Florida as my data point due to its central location in the state between Sebring, St. Pete, and Daytona, Jaunary had slightly below normal temperatures and slightly below normal precipitation. For February, temperatures have been much warmer than normal - in fact, there has been a streak of 11 consecutive days at Winter Haven where the temperature has reached 80 degrees, and 10 days in a row where the low has stayed above 60 degrees. Precipitation has been close to normal, but with a caveat - all the rain in February (0.99 inches) fell on one day early in the month, so 15 of the 16 days this month have not had measurable precipitation. 

The outlook for March calls for the dry and mild pattern of February to continue - above normal temperatures (left image) and below normal precipitation (right image):
Picture
March temperature outllook
Picture
March precipitation outlook
To quantify those images, here are pie charts that show the probabilities of the three possible outcomes - above normal, normal, or below normal temperature and precipitation at Sebring:
Picture
The most likely of the three outcomes in March is above normal temperatures at 41% probability, and below normal precipitation at 46%. 

As with any outlook, keep in mind that this is a prediction of conditions that are averaged over an entire month. There may be a cold and wet weekend that could ruin a race, but this forecast could still be accurate. But overall, I think this is an outlook that bodes well for race fans.

March is when our races forecasts hit full stride. We start the month at Sebring for Trans Am action, followed by IndyCar and PWC at St. Pete the second weekend, followed by the 12 Hours of Sebring the third weekend. After that, we'll have forecasts for PWC at COTA and Trans Am at Road Atlanta. Be sure to follow @RaecastWx on Twitter, as it will be our primary source for our forecasts and live weather updates through the racing season.
Comments

A long term weather outlook for the Rolex 24

1/14/2018

Comments

 
By Doug Schneider

The Rolex 24 is just two weeks away, which is within range of the extended weather models. A lot can change in the forecast over two weeks, so I'm not going to make a detailed forecast this far out. But I'm getting excited about the start of the racing season, so I thought I'd share what I'm seeing in the weather pattern for the race weekend (I did a Twitter thread on this topic this morning on our @RacecastWx account).

Here are a couple images that summarize the pattern for the Rolex 24 weekend. These images are taken from the GFS model, valid Friday 1/26. They are temperature and moisture (precipitable water) anomalies, which means how much the model is expecting temperatures and moisture content to depart from normal. Normal temperatures at Daytona for Rolex 24 weekend are a high of 69 and a low of 48. 
Picture
Image: 850 mb temperature anomaly of the GFS model for 1/26. Contours: 850 mb heights.
Picture
Image: precipitable water anomaly from the GFS model for 1/26. Contours: surface pressure
There is a high pressure ridge located off the east coast that provides a southerly flow across the eastern portions of the U.S., with a low pressure system tracking across the Ohio Valley region and a trailing front down to the Gulf Coast. Because of that pattern, this model is predicting above normal temperatures across Florida (in the range of 3-6 degrees above normal), and slightly above normal moisture content. 

If this general pattern holds true, I am pretty confident that temperatures will be warmer than normal for the Rolex 24. I am less confident about the chances of rain. Just because the moisture is above normal does not necessarily equal rain, as there are other factors in play that are too uncertain this far out.

Check back here the week before the race for the detailed forecast, and be sure to follow @RacecastWx on Twitter, as it will be our main social media feed for all of our posts (and more) this year.
Comments

Long term weather outlook for Florida through March

12/29/2017

Comments

 
By Doug Schneider - @Race4caster

​
The start of the 2018 racing season is almost here! The seasons for IMSA, NASCAR, Trans Am, Pirelli World Challenge, and IndyCar all open in the state of Florida during January, February, and March. So I decided to take a look at what the long term weather outlook is for those months. 

A couple years ago, I wrote a post about long term weather forecasting, and I encourage you to take a look at that to get a better idea of what goes into making a long term forecast, and what the limitations are. It's foolhardy to try and pinpoint specific details about the weather more than 10 days in advance, but it is possible to predict the general weather pattern and the likelihood of temperature and precipitation being above or below normal. The Climate Prediction Center has forecasters that make monthly and seasonal forecasts, and I will be using their forecasts here. 

One important factor in making a long term forecast is to know what the ENSO cycle will do. What's ENSO, you ask? It stands for El Niño-Southern Oscillation (for more information about it, see this post). Whether there is an El Niño or a La Niña in the Pacific will have an impact on the dominant position of the jet stream, which impacts the weather pattern across North America. Currently, La Niña conditions are observed in the Pacific, which is expected to persist through the winter. 

What does that mean for Florida? Typically, La Niña conditions produce warmer-than-normal temperatures and drier-than-normal conditions across Florida during the winter:
Picture
As a result of the La Niña conditions likely continuing through March, the forecasters at the Climate Prediction Center are expecting temperatures above normal (left image) and precipitation below normal (right image) for Florida in the Jan-Feb-Mar time frame (click it to big it):
Picture
Picture
The color scales at the bottom of the images are essentially confidence levels. So for example, the more confident the forecaster is that below normal precipitation will occur for those three months, the higher the probability on the color scale (darker brown). Daytona is the the 40-50% probability area for above normal temperatures, and in the 50-60% probability area for below normal precipitation.

Here's another way to think of it. There are three equal possibilities - conditions near normal, above normal, or below normal. So this is what the forecast above looks like visualized as a pie chart for Daytona:
Picture
 - Visually, that makes more sense to me. Of the three possible outcomes, the most likely is that temperatures will be above normal (42% chance), and precipitation will be below normal (59% chance). 

While this forecast is no guarantee of warm and dry race weekends, I'd say it is good news for race fans who plan to attend these events in Florida. Keep in mind that this forecast covers a period of three months, and the five race weekends (Rolex 24, Daytona 500, TA at Sebring, 12 Hours of Sebring, GP of St. Pete) are only 10 days out of 90. So those 10 days could all be cold and rainy, while the other 80 days could be warm and dry, and the long term forecast for Jan-Feb-Mar would still be accurate. But there would be a lot of unhappy race fans.

We'll have the detailed forecasts for these races (except the Daytona 500 - we leave that to @NASCAR_WXMAN) posted here at RacecastWeather.com a week before the race is run. You can see our entire schedule of race forecasts at the 2018 Schedule link at the top of the website, and be sure to follow all of our social media feeds - we're on Twitter, Facebook, and Instagram. 
Comments

Long term forecasting and the outlook for the Rolex 24

1/15/2016

Comments

 
PictureWaves (called Rossby waves) consist of ridges and troughs in the middle and upper levels of the atmosphere that usually rotate counter-clockwise across the Northern Hemisphere. Image credit: stephenleahy.net
By Doug Schneider (@Race4caster)

I've already been seeing some forecasts for the Rolex 24 posted on social media. Some weather outlets have forecasts that go out over a month in advance - forecasting temperatures down to the degree, how much cloud cover there will be, and even whether rain will be light or heavy. I value my professional reputation too much to do such a thing. In my opinion, making a forecast that specific so far in advance is borderline irresponsible, and misrepresents the current limits of the science of meteorology. Depending on the weather pattern, computer models do not show a reasonable amount of predictive skill until 6 to 10 days in advance, and sometimes even less than that. As a general rule, I would not have any confidence in a specific weather forecast that goes beyond a week.

However, we can predict with some skill whether the weather pattern will favor temperatures or precipitation that are above or below climatology. Let me clarify a few things in that sentence. 

By "weather pattern", I mean the pattern of ridges and troughs that circulate around the Northern Hemisphere in the middle and upper levels of the atmosphere. Think of the atmosphere as waves in the ocean - there are ridges and troughs, and these waves rotate around the earth. The troughs bring cold air southward, and the ridges bring warm air northward. Some troughs are "deeper" (reach farther southward) than others. These waves usually circulate counter-clockwise around the Northern Hemisphere. There are several large-scale signals (El Nino being one of them) in the atmosphere and the ocean that influence the frequency, speed, and amplitude of these waves, allowing meteorologists to make predictions about how the wave pattern will change. The troughs and ridges influence the weather you feel at the ground by transporting masses of cold or warm air, and dry or moist air. They also generate areas of rising air or sinking air.

​By "climatology", I mean the weather than can typically be expected over a region of the globe at a certain time of the year, based on a 30-year average of temperature and precipitation (this average is also called "normal"). Based on climatology for Daytona Beach, Florida, a typical day in late January around the Rolex 24 weekend will have a high temperature of 69 degrees, a low temperature of 48 degrees, and about a 35% chance of rain. Here's a nice website that gives the climatology of Daytona Beach throughout the year.

If we can predict the pattern of waves across the Northern Hemisphere a few weeks in advance, then we can have some idea if the chances of rain are higher or lower than climatology, or if temperatures will be higher or lower than climatology. We can have a general idea of what might be expected for a region over a period of a few days in comparison to the 30-year average. However, we cannot skillfully predict what the temperature will be on a specific day in a specific location a month in advance.

The Climate Prediction Center is a branch of NOAA that issues these long term weather outlooks. They make weekly, monthly, and seasonal forecasts of how the weather will deviate from climatology. They predict if the temperature and precipitation is likely to be above or below normal, expressed as a "percent chance" that reflects their confidence. Sometimes the predicted wave pattern does not give a clear signal of whether temperatures or precipitation will be above or below normal. In this case, their forecast will be for "equal chances" of above or below normal.

Here's their latest outlook that covers the Rolex 24 weekend:

Picture
CPC temperature probability outlook (click to enlarge)
Picture
CPC precipitation probability outlook (click to enlarge)
The image on the left of the probability of temperature above or below normal shows equal chances across Florida, so there's no strong signal that temperatures will either above or below normal. The most likely scenario is that temperatures will be fairly close to normal.

The image on the right shows that there is a 60% chance or greater that precipitation will be above normal.

​Keep in mind that this forecast covers a period of two weeks, and the Rolex 24 weekend is only two days out of the 14 days that it covers. So those two days could be completely dry, but the other 12 days have rain, and the forecast of above normal rainfall would still be accurate. 

That's the extent of what meteorologists can confidently tell about the weather this far out. If you see forecasts that tell you more detail than that two weeks away, take them with a grain of salt. 

I'll have the full Rolex 24 forecast up a week before the race, on January 24. 
Comments

    Social Feeds


    Instagram


    Authors

    Doug Schneider
    Scott Martin
    Stephen McCoy

    Harris Cooley 


    Partners

    Picture
    Picture
    Picture
    Picture
    Picture

    Categories

    All
    F1
    IGTC
    IMSA
    Indycar
    Le Mans
    MRTI
    NASA
    Outlooks
    Photos
    PWC
    Racecasts
    SCCA
    SRO
    Trans Am
    TUSC
    Verification
    Weather Education
    WEC


    Archives

    March 2023
    February 2023
    January 2023
    December 2022
    November 2022
    October 2022
    September 2022
    August 2022
    July 2022
    June 2022
    May 2022
    April 2022
    March 2022
    February 2022
    January 2022
    December 2021
    November 2021
    October 2021
    September 2021
    August 2021
    July 2021
    June 2021
    May 2021
    April 2021
    March 2021
    January 2021
    December 2020
    November 2020
    October 2020
    September 2020
    August 2020
    July 2020
    June 2020
    March 2020
    January 2020
    December 2019
    November 2019
    October 2019
    September 2019
    August 2019
    July 2019
    June 2019
    May 2019
    April 2019
    March 2019
    February 2019
    January 2019
    December 2018
    November 2018
    October 2018
    September 2018
    August 2018
    July 2018
    June 2018
    May 2018
    April 2018
    March 2018
    February 2018
    January 2018
    December 2017
    November 2017
    October 2017
    September 2017
    August 2017
    July 2017
    June 2017
    May 2017
    April 2017
    March 2017
    February 2017
    January 2017
    December 2016
    November 2016
    October 2016
    September 2016
    August 2016
    July 2016
    June 2016
    May 2016
    April 2016
    March 2016
    February 2016
    January 2016
    December 2015
    November 2015
    October 2015
    September 2015
    August 2015
    July 2015
    June 2015
    May 2015
    April 2015
    March 2015
    February 2015
    January 2015
    December 2014
    November 2014
    October 2014
    September 2014


Powered by Create your own unique website with customizable templates.