The 2019 racing season is almost upon us, and we're excited to bring you another year of weather forecasts! You can check out the full schedule of race forecasts that we have planned for the year in the 2019 Schedule link at the top of the page. There may be some additional races to be added later, depending on whether we can find sponsorship (and if you're interested in sponsoring our forecasts, click on the Contact link at the top of the page).
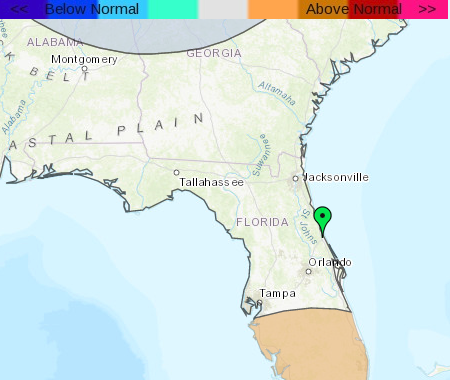
During January, February, and March, the season openers for all the major North American racing series take place in Florida. Around this time each year, I take a look at the long term outlook for Florida as forecast by the Climate Prediction Center. These guys are the experts at long term forecasting on time scales from a week to several months, so the graphics you see below are taken directly from them. If you'd like to learn more about what goes into making a long term forecast, see this post I wrote a few years ago.
Water temperature at the ocean surface is a big factor in predicting the long term weather patterns. Perhaps the most significant and well known ocean temperature anomaly is the El Niño-Southern Oscillation (ENSO) cycle (for more info about El Niño, click here). It affects the location of the jet stream across the Pacific Ocean, which in turn affects the track of low pressure systems across the United States. The change in the typical tracks of storms can cause increased precipitation across California and the southern U.S. While long term forecasters cannot say exactly how much rain will fall or how warm/cold temperatures will be, knowing if there will be an El Niño can help forecasters determine whether precipitation and temperature is likely to be above or below normal over a period of several months in a certain area.
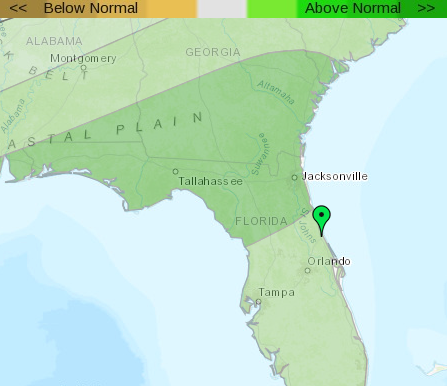
The CPC is expecting a weak El Niño through the rest of the winter and into the spring. When there is an El Niño, the southeastern United States tends to have a higher likelihood of above normal precipitation. The image below shows that Daytona Beach is located in the area that has a 50% chance of seeing above normal precipitation during January, February, and March.
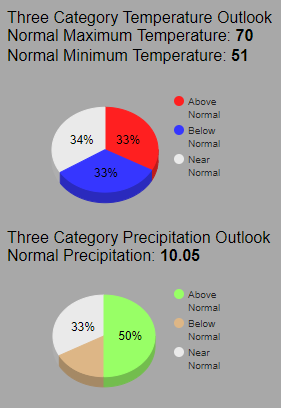
The normal amount of rainfall at Daytona Beach during January, February, and March is 10.05 inches. The outlook is telling us that the amount of rainfall during the same period in 2019 is likely to be more than that. It does not tell us how much more, or when the rain is going to occur. It is possible that every day of racing in Florida could be dry, and yet this outlook would still be accurate.
That's the extent of what meteorologists can tell about the weather this far out in advance. You will probably see forecasts out there that show the exact temperature and rain chance for a specific day weeks in advance, but don't take those forecasts too seriously. Those type of forecasts are going beyond the limits of what science can tell us with reasonable confidence.


