By: Stephen McCoy
For the past three races of the Rolex 24 hours of Daytona, there’s been periods of rain that have been bothersome to teams, drivers, track officials, and fans. But the rain seen at the 2019 iteration stands out from the previous two years. A veritable deluge of precipitation began in the 4:00-5:00 hour on Sunday and refused to let up, causing IMSA to call the race ten minutes before the conclusion of 24 hours after two red flag periods with multiple full course yellows in between. The question though is why all the rain? What made this year’s weather conditions so different than those seen recently?
To begin, I’ll look at the atmosphere on Saturday night.
To begin, I’ll look at the atmosphere on Saturday night.
The data gained from the 7PM weather balloon launch out of Cape Canaveral produced the atmospheric sounding above. A detailed explanation of how to understand the sounding can be found HERE, but I mainly want to focus on the air temperature and dew point temperature in the skew-t diagram (red and green lines in the largest box). While the air temperature and dew point temperature differ slightly with the observations from Daytona Beach International Airport, the general atmospheric conditions were similar: dry air at the surface and low levels, with saturated air (with the result being overcast skies) aloft in the mid levels. This type of sounding is not conducive to precipitation as there isn’t enough moisture below the cloud deck to continue to fall to the ground.
| | |
The map on the left shows the 500 mb geopotential height with wind barbs and temperatures at the same time as the sounding. A very prominent longwave trough is seen extending from Ontario in Canada through Durango in Mexico, with a similar trough seen on the right at 300 mb. Due to the center axis of the trough extending through continental North America, the downstream portion to the east is in zonal flow, or a typical west-to-east wind pattern.
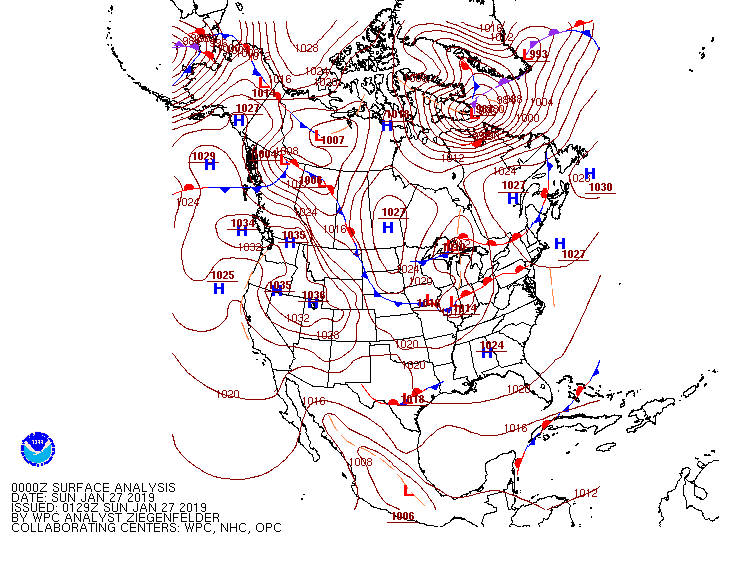
At the surface, notice the stationary front located between southern Florida and the Caribbean. This front became the remnants of the cold front that moved through the region on Thursday. At the 300 mb level, divergence is a term used for diverging air caused by either a change in speed or a change in direction. When air diverges in the upper levels, air converges in the lower levels and at the surface, creating an area of low pressure. This divergence was seen Saturday night in the same location as the surface stationary front and a low pressure system, though a weak one, developed by the traditional mid-latitude cyclone model.
One thing to also mention about the surface is a weak high pressure system was centered over central Alabama for most of Saturday, which brought winds to the track mainly from the north to northwest. The dry air at the surface was mostly due to the wind direction, as it crossed over land instead of water.
One thing to also mention about the surface is a weak high pressure system was centered over central Alabama for most of Saturday, which brought winds to the track mainly from the north to northwest. The dry air at the surface was mostly due to the wind direction, as it crossed over land instead of water.
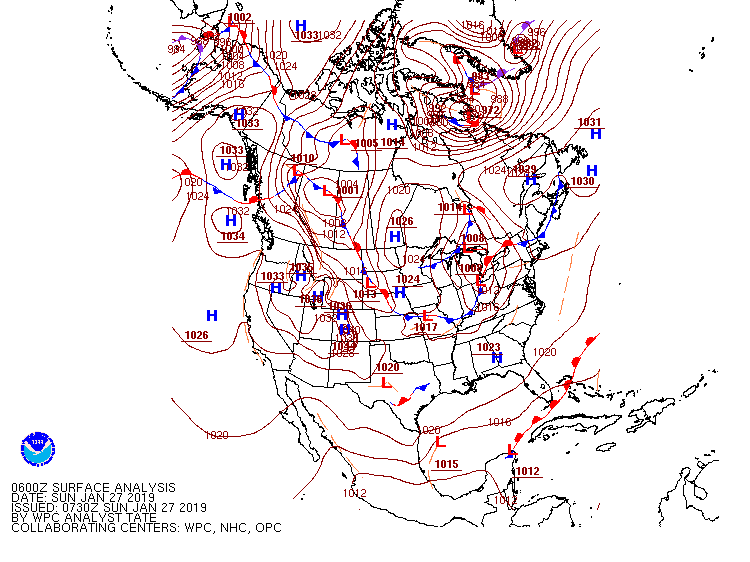
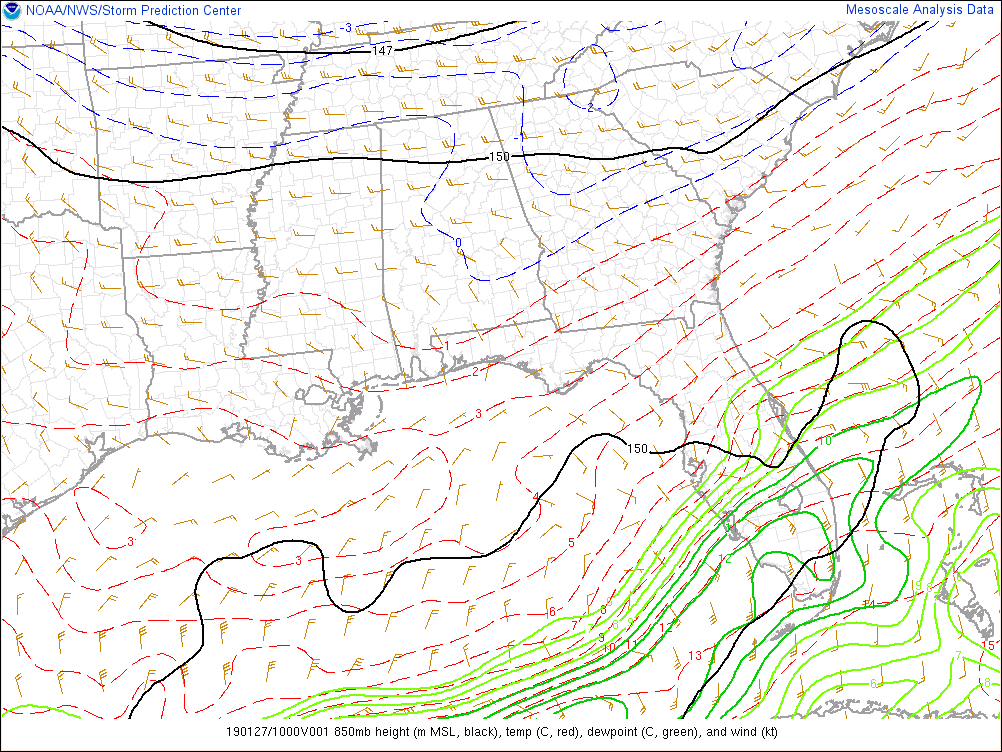
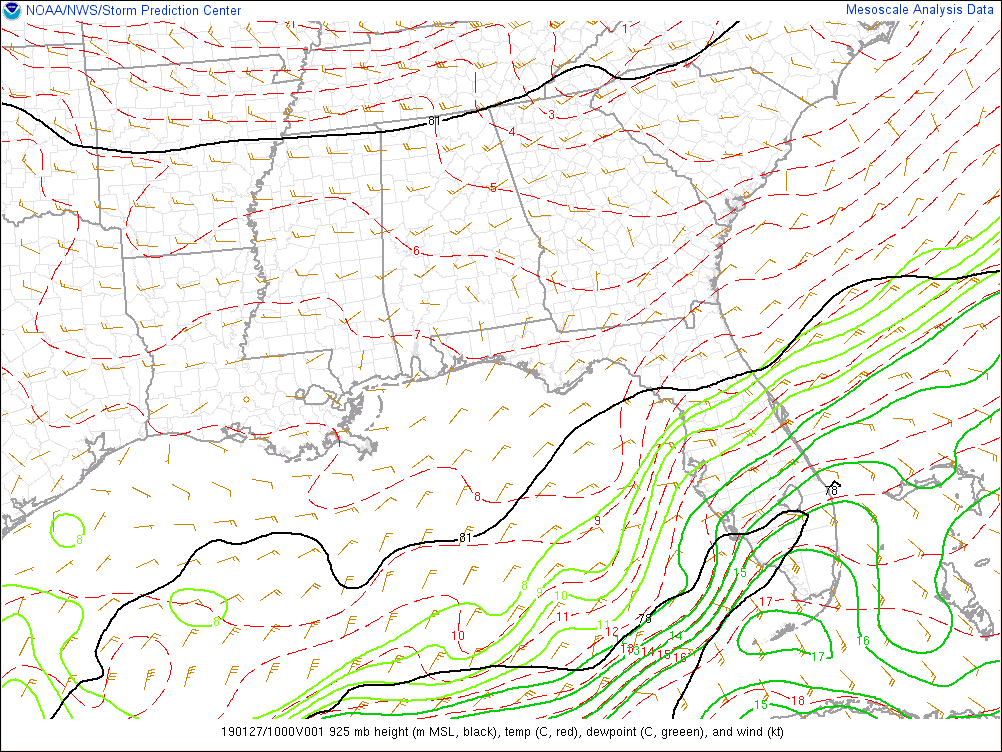
Looking at the surface just after midnight, the stationary front off the southern coast of Florida is now shown to be a warm front, extending from a low pressure system centered at the coast of the Yucatan Peninsula. Precipitation at the track began in the 4:00-5:00 hour, though exact timing isn’t certain as weather observations at Daytona Beach International Airport are only recorded on an hourly basis. Though, we can see that in the 925 mb and 850 mb maps, the air above Daytona Beach is almost fully saturated.
 |  |
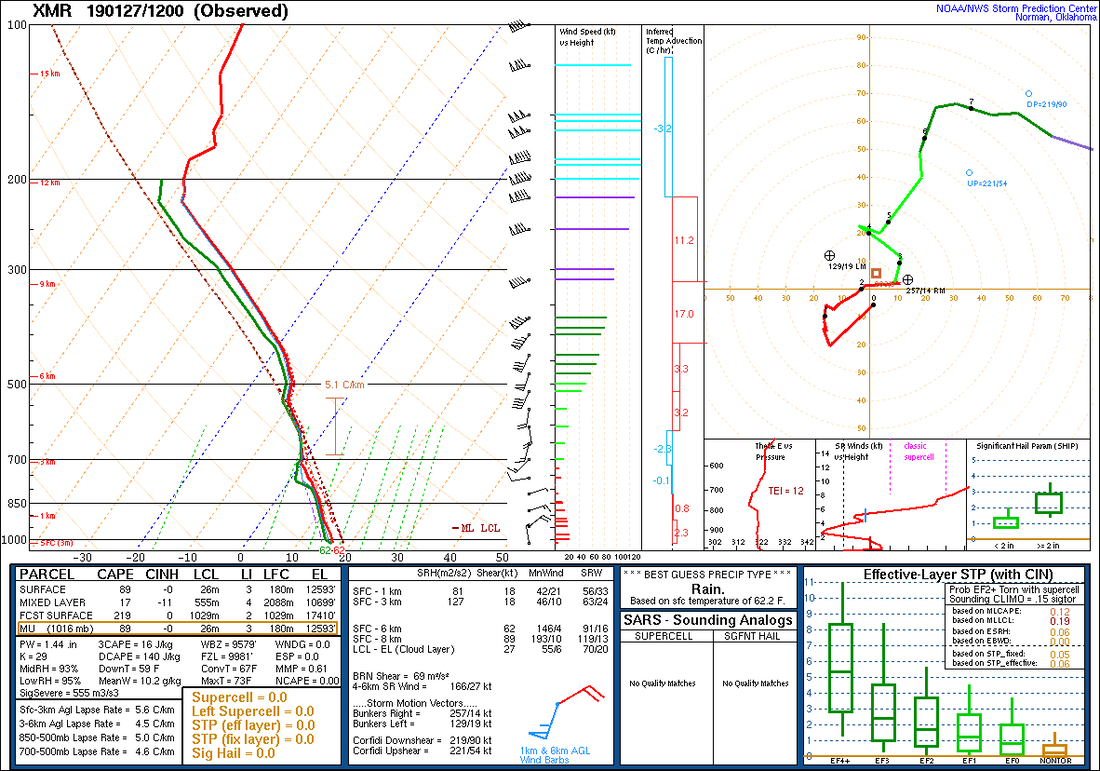
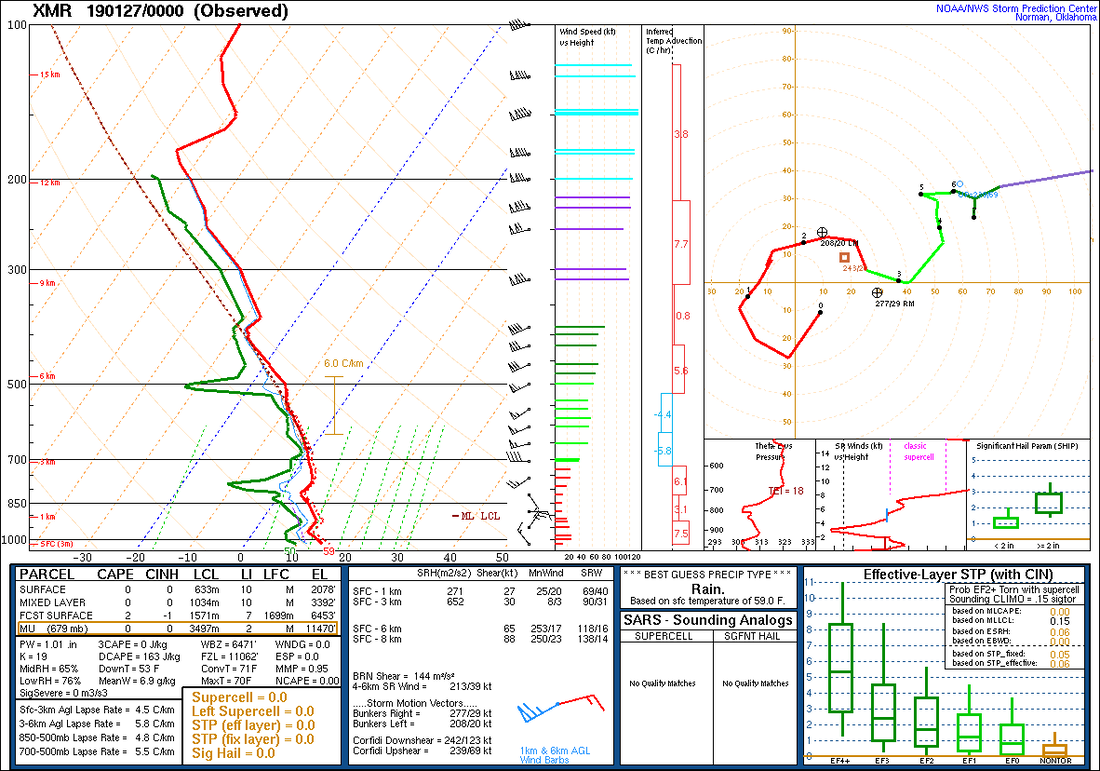
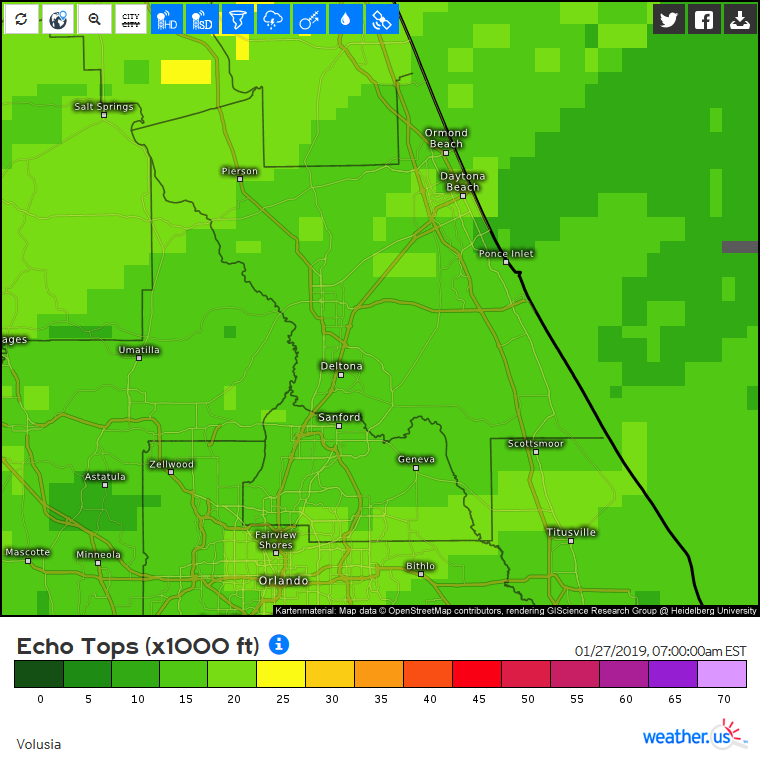
The 12Z (7:00 am) weather balloon launch out of Cape Canaveral produced this sounding. The skew-t plot shows the red (air temp) and green (dew point temp) lines near each other throughout almost all of the atmosphere. Again, the exact parameter values may differ slightly, but the overall pattern between Cape Canaveral and Daytona Beach were similar. Full saturation appears to have occurred around 15-20 thousand feet (about 4500-6000m) as shown by the echo top parameter (top of the cloud layer) from the Melbourne, FL radar. Any moisture added to this layer would fall towards the ground due to the atmosphere wanting to remain stable, with saturation maxing out at 100%. In this sounding, the precipitation continues to fall until it reaches the ground. Even though there is an area of lower saturation around 750-800mb, it’s small enough to where it doesn’t hinder the precipitation’s ability to reach the ground.
If you compare the two soundings above, you can see that the 500 mb level is now almost fully saturated and about 2-3 °C warmer than Saturday evening. The reason for that can be seen in the 500 mb and 300 mb maps below.
| | |
The center axis of the trough at the mid and upper levels is now positioned further to the east, while also extending further south towards the tropics. The winds over Tampa are now coming from the south/southwest as opposed to the west/southwest and if you’ll notice only a degree separates the air and dew point temperatures. So where did this sudden moisture come from?
| | |
These maps show sea surface temperatures from January 26th and January 27th, respectfully. There isn’t a large difference between them, but the thing to note is the large area of warm water in the eastern region of the Gulf of Mexico. The warm air evaporating over this area is carried toward the Florida peninsula by the 500 mb winds on Sunday, but not on Saturday. The 500 mb winds on Saturday were oriented in a more west-to-east pattern, as previously stated, which meant that the winds travelled mainly over the cooler regions of the Gulf where surface tempreatures were in the low 20’s °C. As the mid level trough continued tracking eastward on Sunday, the center of the trough moved through a warmer region off the coast of Mexico where sea surface temperatures exceeded 24 °C, with the area just downstream of the center of the trough moving through an even warmer region. The reason why the 500 mb winds didn’t pick up the same amount of warm, moist air on Saturday versus Sunday is much like how if you hold your hand over a stove burner at a constant height, you may not feel the heat (or feel very little heat) off the burner on a low setting, but will feel the burner getting hotter on a higher setting. The map below shows the movement of moisture at the 500 mb level at 7:00 am.
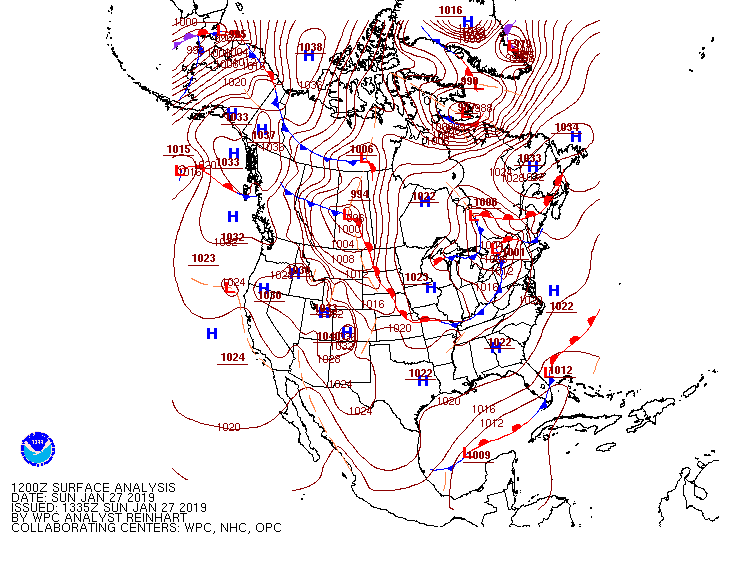
As for the surface, the low pressure system that was centered near the Yucatan peninsula is now off the eastern coast of Florida, complete with warm and cold fronts. This rapid movement from the system is caused by surface pressure falling along the warm front along with pressure rising behind the system (in this case over the southern region of the Gulf) and is all assisted by the eastward motion of the mid level and upper level troughs. The increase in moisture at the surface is primarily due to the low pressure system off the coast and the high pressure system centered over Alabama and Georgia.
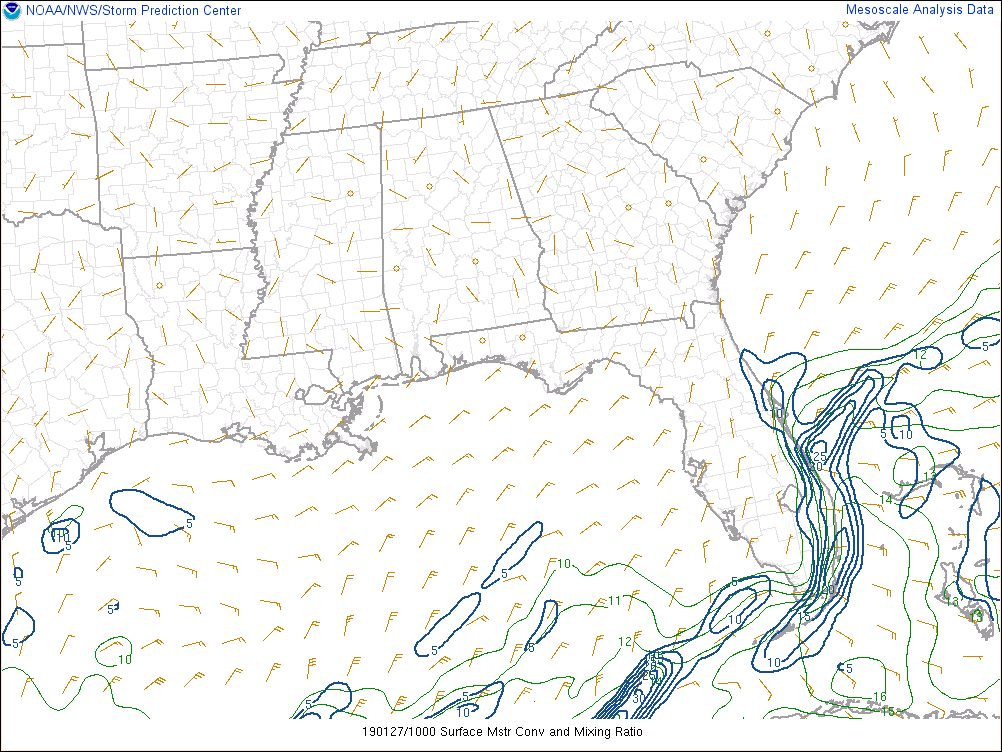
The anticyclonic (clockwise) rotation around the high pressure system, combined with the cyclonic (counter-clockwise) rotation around the low pressure system created increased winds as the day progressed. The warm front extending from the surface low helped to push dew point temperatures northward, which allowed the air at the surface to approach saturation. In addition, the low level winds were able to transport moisture to the region as they came across the water just off the Atlantic coast. The map below shows the moisture convergence at the surface at 5:00 am, around the start of precipitation.
The anticyclonic (clockwise) rotation around the high pressure system, combined with the cyclonic (counter-clockwise) rotation around the low pressure system created increased winds as the day progressed. The warm front extending from the surface low helped to push dew point temperatures northward, which allowed the air at the surface to approach saturation. In addition, the low level winds were able to transport moisture to the region as they came across the water just off the Atlantic coast. The map below shows the moisture convergence at the surface at 5:00 am, around the start of precipitation.
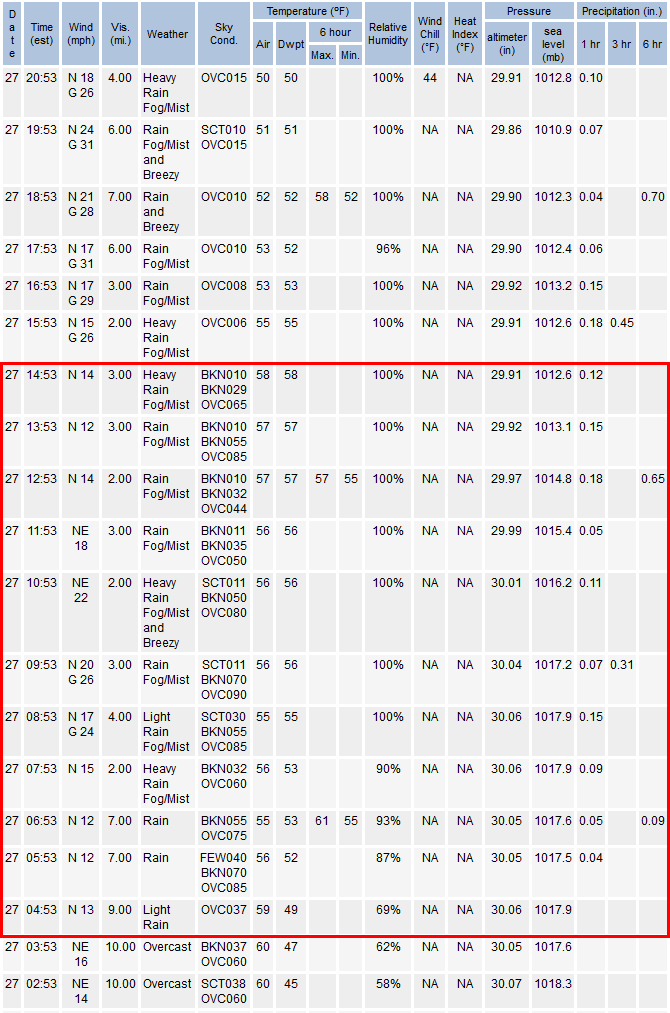
In total between Sunday morning and the end of the race, about 0.9 inches of rain fell at the track according to the observed conditions at Daytona Beach International Airport. A more accurate measurement is likely above an inch as the cut off time for precipitation occurred at 1:53, where the race concluded close to 2:30. The table below shows the recorded observations from 2:53 am until 8:53 pm on January 27, 2019 with the observations in the red box occurring between the beginning of precipitation and the conclusion of the race. Something to note is that starting at 7:53 am fog/mist was recorded at the surface, which is the result of fully (or neraly) saturated air. In fact, looking at Relative Humidity, the air at the surface was fully saturated (other than at 7:53 am) once the heaviest rain began to fall.