
By Doug Schneider
With no races on our schedule for the upcoming Easter weekend, I thought it would be a good time for another weather education post. To find our previous educational posts, you can click on this link to the Weather Education category of the blog. Since most of the country is heading into severe weather season, it's a good time to learn the basics about how weather radar works.
The word radar is actually an acronym that stands for RAdio Detection And Ranging. Radar was originally designed to detect enemy aircraft during World War II, and the ability of radar to detect precipitation was considered a nusiance. After the war, radar was put to civilian use, and radars were adapted to specifically detect precipitation. Radar technology has advanced by leaps and bounds since that time, but the general principles of how radar works remain basically the same.
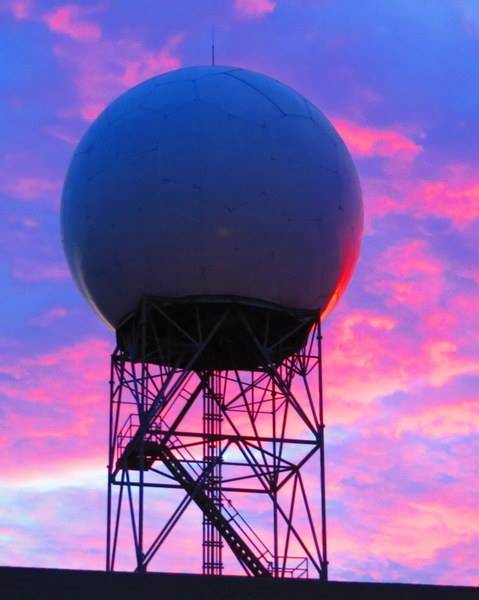
The image on the left is what a typical radar used by the National Weather Service looks like from the outside, called the WSR-88D. Inside the white sphere (radome) is the radar antenna. It looks like a large satellite dish (38 feet in diameter) on top of a large pedestal (click here for a video tour inside the radome).
As the radar antenna turns, it emits short bursts of radio waves, called pulses, with a "listening period" in between. The transmitted radio waves move through the atmosphere at about the speed of light. The pulses bounce off whatever objects they might encounter (rain, hail, insects, airplanes, dust, etc.), and the radar listens for the portion of that pulse that returns back to the radar. By knowing the direction that the radar was pointed and the time it took for the pulse to return, the radar can calculate the location of the target.
With no races on our schedule for the upcoming Easter weekend, I thought it would be a good time for another weather education post. To find our previous educational posts, you can click on this link to the Weather Education category of the blog. Since most of the country is heading into severe weather season, it's a good time to learn the basics about how weather radar works.
The word radar is actually an acronym that stands for RAdio Detection And Ranging. Radar was originally designed to detect enemy aircraft during World War II, and the ability of radar to detect precipitation was considered a nusiance. After the war, radar was put to civilian use, and radars were adapted to specifically detect precipitation. Radar technology has advanced by leaps and bounds since that time, but the general principles of how radar works remain basically the same.
The image on the left is what a typical radar used by the National Weather Service looks like from the outside, called the WSR-88D. Inside the white sphere (radome) is the radar antenna. It looks like a large satellite dish (38 feet in diameter) on top of a large pedestal (click here for a video tour inside the radome).
As the radar antenna turns, it emits short bursts of radio waves, called pulses, with a "listening period" in between. The transmitted radio waves move through the atmosphere at about the speed of light. The pulses bounce off whatever objects they might encounter (rain, hail, insects, airplanes, dust, etc.), and the radar listens for the portion of that pulse that returns back to the radar. By knowing the direction that the radar was pointed and the time it took for the pulse to return, the radar can calculate the location of the target.
The WSR-88D's pulses have an average transmitted power of about 450,000 watts. By comparison, a typical home microwave oven will generate about 1000 watts of energy. However, because of the very short period the radar is actually transmitting, when the time of all pulses each hour are totaled (the time the radar is actually transmitting), the radar is "on" for a little over 7 seconds each hour. The remaining 59 minutes and 53 seconds are spent listening for any returned signals.
The "D" in the WSR-88D name stands for Doppler. Doppler radars can detect if objects are moving toward or away from the radar by using the Doppler Effect - objects moving inbound have a different frequency from objects moving outbound. The Doppler Effect is why a race car sounds different as it is approaching you than when it is moving away from you. This ability to detect motion has greatly improved meteorologists' ability to see inside thunderstorms and determine if there is rotation in the cloud, often a precursor to the development of tornadoes.
One of the images that meteorologists see from the radar (and the most common image that is seen by the general public) is called reflectivity. It is a measure of how much energy has reflected off an object and returned to the radar. Objects that are large in size or in high concentration will return more energy than objects that are small or are sparsely concentrated. Hail will have a much higher reflectivity than drizzle. It is measured in units of dBZ, or decibels of reflectivity, which are the values that you will see on a radar color scale.
The left half of the above image shows reflectivity of a thunderstorm. The dark red colors are areas of very heavy rain and/or hail. The right side of the image shows the storm-relative radial velocity of the same storm, indicating the motion of the precipitation (subtracting out the motion of the storm). The bright green in the center indicates very strong motion toward the radar, while the bright red/pink right beside it indicates very strong motion away from the radar (the radar is located off the right side of the image). Now imagine a counter-clockwise circle that passes through the bright green and bright red areas on its edges. This is how meteorologists can see rotation within a thunderstorm, which often indicates the presence of a tornado. Also notice how the higher reflectivity is wrapping counter-clockwise around the area of rotation. This reflectivity signature is called a hook echo, and is another indicator that a tornado may be present or about to form. The dark red area of reflectivity in that hook echo may be debris that has been lofted into the air by the tornado.
The radar scans the atmosphere by rotating 360 degrees, but after completing a rotation, it tilts upward to a higher elevation angle. The image below shows some of the different elevation angles that the radar can scan. The time that it takes to complete a full scan from bottom to top is about 5 minutes.
The radar scans the atmosphere by rotating 360 degrees, but after completing a rotation, it tilts upward to a higher elevation angle. The image below shows some of the different elevation angles that the radar can scan. The time that it takes to complete a full scan from bottom to top is about 5 minutes.
There are a few limitations of radar that are evident in this image. First, notice that as you move farther away from the radar (from left to right), the lowest elevation angle (0.5 degrees) moves higher and higher off the ground, so that by the time you are 80 miles away from the radar, the lowest the radar can see is about 5000 feet above the ground, and at 120 miles away, it can only see 10,000 feet above the ground. Essentially, the radar is blind from the ground up to this level. This is inevitable because of the curvature of the earth. The radar beam goes straight out, but underneath it, the earth curves away. Any precipitation or rotation that occurs that low and that far from the radar cannot be seen. If the radar scanned any lower, the beam would encounter tree tops and other unwanted objects close to the radar. The National Weather Service compensates for this weakness by the strategic positioning of radars across the country to minimize the "blind area" as much as possible, especially for populated areas.
Another problem is the "cone of silence", located near the radar on the left end of the image. Despite what you may have heard on the movie "Twister", the cone of slience has nothing to do with the center of a tornado. The highest elevation angle of the WSR-88D radar is 19.5 degrees, and this creates another blind spot near the radar that is shaped like a cone. Strong thunderstorms can grow taller than 50,000 feet, and a good portion of those storms cannot be seen when they are located within 10 miles of the radar. If higher elevation angles were added, then more time would also be added to complete the full scan - and reducing wasted time is critical when severe thunderstorm and tornado warnings need to be issued.
Scanning the atmosphere vertically allows meteorologists to see the entire depth of a thunderstorm, such as in the image to the left, which is a cross section of reflectivity through a severe thunderstorm that produced large hail. By seeing the storm's structure, we can get a better idea of how severe the storm could be, and whether is is strengthening or weakening. Seeing rotation in the midlevels of a thunderstorm can sometimes be a precursor to the formation of a tornado at the ground.
There are numerous other products from the radar that can tell us things like hail size, precipitation shape and concentration, the height of a thunderstorm, how much rain has fallen, and even if a tornado is lifting debris into the air. Radar has been an invaluable tool for meteorologist to help them protect people from hazardous weather.
Hopefully, when you click on our live radar and see the reflectivity image, you'll now have a better understanding of what you're seeing. If you have any questions about how radar works, please ask in the comments or on Twitter at @Race4caster.